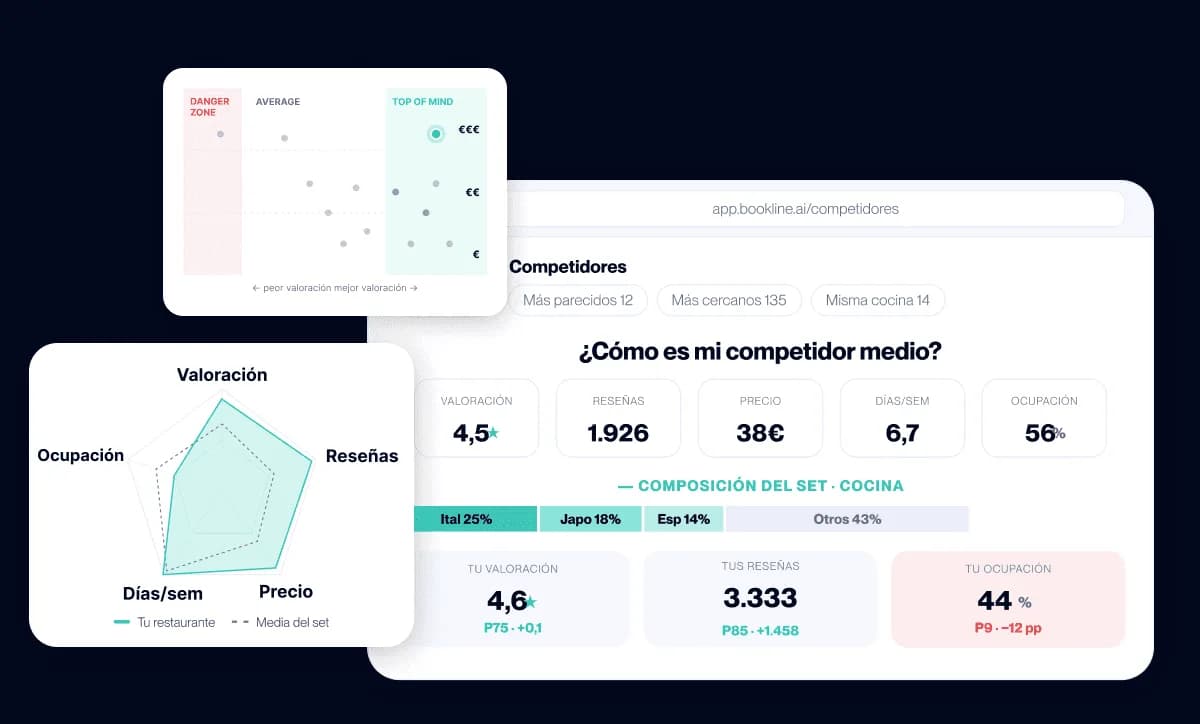
Knowing who your competitors are is the easy part. The hard part is understanding where they beat you, where you beat them, and what you should be doing differently from tomorrow.
Bookline's Radar de Competencia cross-references public data from hundreds of restaurants in your area to give you that comparison in two minutes. But data doesn't make decisions on its own: you need to know what to look for and what each figure actually means.
Here are 10 signals the Radar may be revealing about your restaurant, and the concrete action you can take on each one.
1. Your rating is below the average for your set
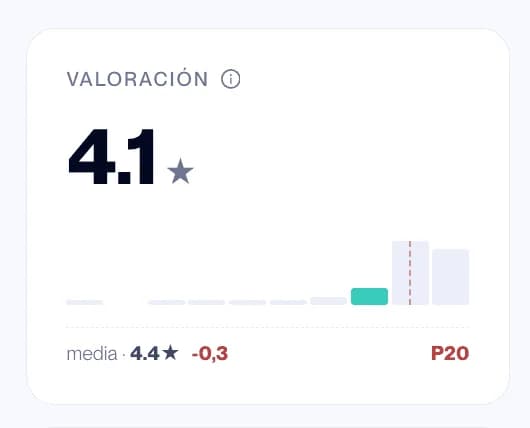
The Radar shows your rating against the average for your competitors and places you in a percentile. If you are in P20, that means 80% of comparable restaurants are rated higher than you.
More useful than the figure itself is the calculator underneath it: "X 5-star reviews to reach your target rating". This isn't about improving in the abstract — you know exactly how many positive reviews you need for the next visible jump.

What to do: Make that number your quarterly target. Put a systematic process in place to ask every satisfied customer to leave a review: at the moment they pay, or the next day over WhatsApp while the memory is still fresh.
2. You have more reviews than the average, but your rating doesn't reflect that volume
Review volume and rating don't always go hand in hand. The Radar shows the two figures separately, with your percentile in each.
If you lead on number of reviews but your rating is mediocre, the problem isn't a lack of visibility — it's that the experience isn't living up to the expectation your online presence creates, or that you aren't actively managing negative reviews.
What to do: Reply to every negative review publicly and constructively. A well-written response to a bad review can be more persuasive to a potential customer than ten 5-star reviews with no reply at all.
3. Where you sit in the price-quality matrix tells you which zone you're competing in
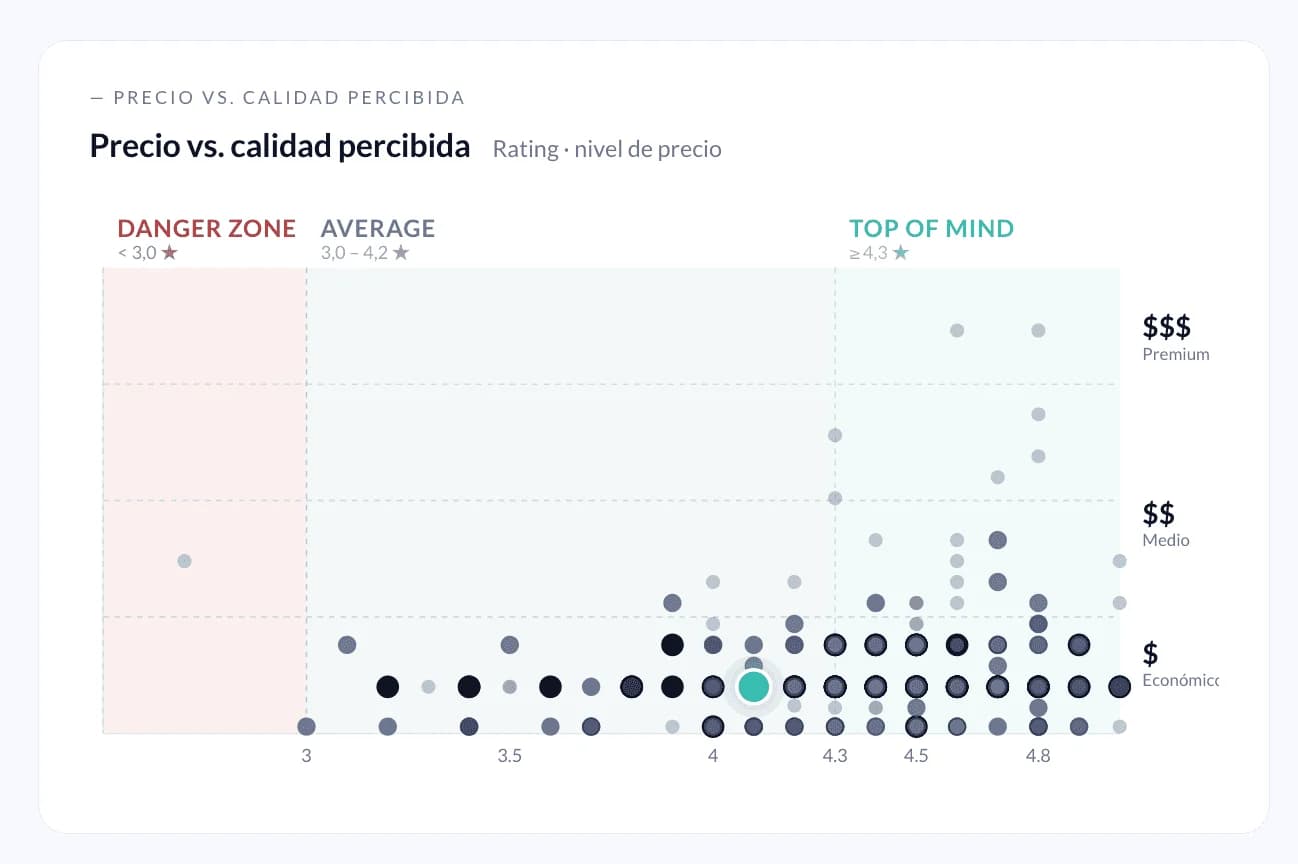
The Radar cross-references your price level (budget, mid-range, premium) with your average rating and places you in one of three territories:
- Danger Zone: the customer doesn't see the value in what you offer. The highest-risk zone.
- Average: middle of the pack. No clear competitive advantage, but no urgent alarm either.
- Top of Mind: high perceived quality. This is where you find the restaurants that fill tables on word of mouth.
What to do: If you're in the Danger Zone, you have two levers: improve the actual experience or lower the price expectation. If you're in Average and want out, the fastest route is to lift your rating — which takes us back to point 1.
4. The make-up of your set reveals who you're really competing against
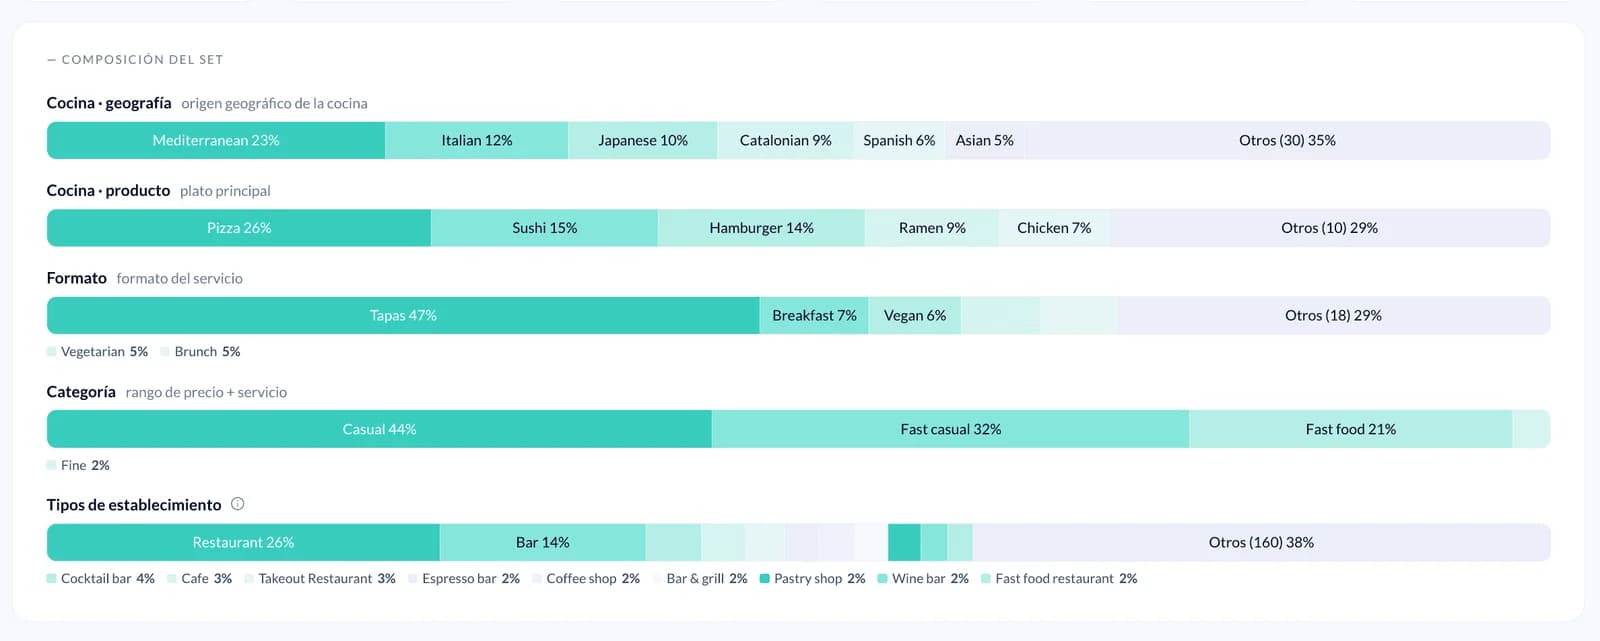
One of the most underrated figures in the Radar is the make-up of your set: the cuisine type, format and category of the restaurants you're up against.
If 47% of your competition is tapas and 44% sits in the Casual category, you aren't competing against the fine dining place in your neighbourhood — you're competing against the tapas bar on the corner with a better Google ranking. That completely changes how you think about differentiation.
What to do: Use the make-up of your set to work out where you can be unique. If Pizza dominates with 26% and you do pizza, you're in the most saturated segment. If you do something that accounts for only 5%, you have room to stand out — but also fewer reference points for setting your price.
5. Your occupancy against the set average, in every time slot
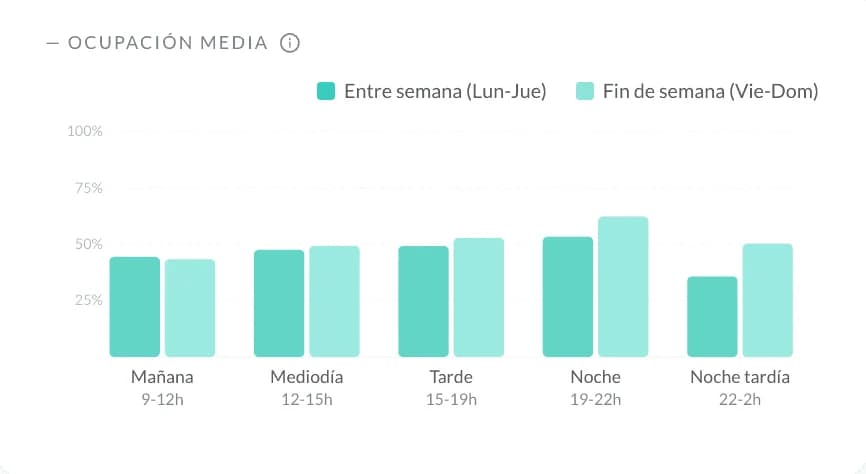
The Radar doesn't just give you average weekly occupancy — it breaks it down by time slot and separates weekdays from weekends.
If the set averages 55% occupancy on weekday evenings and you're at 30%, that isn't a general demand problem: it's a specific gap at a specific moment. And specific problems have specific solutions.
What to do: Identify the slot where your occupancy differs most from the average. Is it lunchtime? Late evening? That's the slot to act on first — whether with a distinctive menu, communication aimed at that time of day, or simply by making sure the phone gets answered and booking requests get a reply.
6. How many of your competitors are open in each slot, when you aren't
The Radar's opening-hours module shows you the percentage of restaurants in your set that are open at each point in the day. One figure may surprise you: if 94% of your competition is open in the afternoon (15:00–19:00) and you aren't, it isn't that those hours are dead — it's that you're off the map for customers searching at that moment.
What to do: Assess whether the hours where your coverage is thinnest would be profitable to open. Sometimes they wouldn't, but it is worth doing the maths explicitly. If you decide not to open, at least make it a conscious decision — not a blind spot.
7. The days of the week when the set fills up and you don't
The Radar shows you, day by day, how your occupancy compares with the average for similar restaurants and with the leader of your set.
If you fill up on Friday in line with the average but on Monday and Tuesday you're well below the leader, those are your opportunity days. Not days where "there's simply less demand" — days where your strongest competitor is doing something you aren't.
What to do: Look at what the leader does on those days: a set menu? A special offer? Better visibility on booking platforms? And if you can't find out, at least run something distinctive on those days (a message to your customer base, a discount for booking ahead, a set lunch menu).
8. You open plenty of days but few hours: the real coverage problem
The Radar cross-references two variables that usually sit apart: days open per week and hours open per day. You can be at P100 on days (open every day of the week) and at P41 on hours — which means your real coverage is lower than it looks.
A restaurant that opens 7 days but closes at 21:00 competes very differently from one that opens 5 days but stays open until 2:00. Average occupancy doesn't care about days — it cares about when demand exists and whether you're open to capture it.
What to do: Work out how many hours of real demand you're covering compared with your competition. If the set runs at 70% occupancy in the late-night slot (22:00–2:00) and you close at 22:00, there's a segment of demand you simply never reach.
9. How open the set is on Mondays (and what that says about your market)
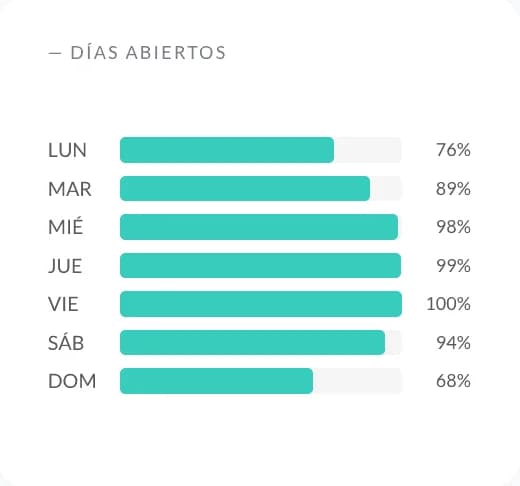
The Radar's days-open module shows the percentage of the set that opens on each day. In many urban markets, Monday is the day with the greatest asymmetry: some restaurants close, others open and capture all of that day's demand.
If 76% of your competition closes on Mondays and you open, you can be the go-to restaurant that day. If 99% opens on Thursday and you don't, you're losing one of the set's highest-demand days.
What to do: Use this module to make opening-hours decisions on data, not instinct. The day most of them close could be your best opportunity — or a dead day. The Radar tells you which is which in your particular market.
10. The table of similar restaurants: the head-to-head that stings most
The most direct part of the Radar is the list of similar restaurants, with their figures one by one: rating, reviews, price, occupancy, days open and services available.
There are no averages here to soften reality. You see that the restaurant 84 metres away has 1,786 reviews and 25% occupancy — and you realise that review volume doesn't guarantee occupancy. Or that the one with 4.5 stars and 1,180 reviews opens 7 days a week and runs at 56% occupancy. The patterns start to emerge.
What to do: Pick the 3 restaurants on the list that most resemble you on price and format, and compare them metric by metric. Not to copy them, but to understand which variable explains the difference between their occupancy and yours. There is almost always a single main cause — and it is usually more actionable than it looks.
Data is the starting point, not the destination
Competitor analysis for restaurants only pays off when it ends in a decision. Not in a document, not in a good-looking chart — in something you change next week.
The Radar de Competencia gives you the diagnosis in two minutes. At Bookline we help restaurants act on it: more bookings captured, more reviews earned systematically, and a way of managing customer relationships that doesn't depend on someone being there to watch the phone.
Want to see how this applies to your restaurant? Book a free demo.